
With applications and end users as distributed as they’ve become, most organizations have adjusted their workforces to hybrid environments. With this adjustment, IT must ensure excellent end user experiences no matter where users or applications are located. This means understanding each user’s environment—even those not under IT’s control.. Without the proper tools in place, troubleshooting takes longer and undue burden is placed on network operations teams lacking the ability to quickly pinpoint issues.
In this blog, we’ll dive into a useful networking troubleshooting tool, “traceroute”, or “tracert” on Microsoft Windows.
What is traceroute?
Traceroute is a tool built into many different devices and operating systems, such as Microsoft Windows, Macs, or routers and switches. Traceroute is a network diagnostic tool which provides the path packets take between a device and a destination. This destination can be anywhere from a website on the internet to local devices on the network (e.g., printers). Traceroute indicates the number of hops between the two points on the network and provides the round trip time (RTT) for each one of the hops.
Why use traceroute?
Traceroute is used for troubleshooting network problems related to connectivity, congestion, or performance. Herein, it indicates where packets are dropped or delayed. Additionally, it can be used by network operations teams to analyze the route(s) packets take to ensure they’re on the optimal path. In some cases, it can help network engineers understand if hops along the path are oversubscribed, which would result in a poor end user experience.
Traceroute example
What happens when packets travel over the internet? They typically traverse many layer 3 devices (routers) before eventually reaching their destination. Tools such as traceroute can help identify an issue, but keep in mind that it is NOT scalable to manually run traceroute from each end user’s device.
Here is a typical output from a traceroute:
|
traceroute to 8.8.8.8 (8.8.8.8), 64 hops max, 52 byte packets 1 192.168.1.1 (192.168.1.1) 1.252 ms 0.685 ms 0.676 ms 2 10.0.0.1 (10.0.0.1) 4.858 ms 4.949 ms 4.951 ms 3 172.16.10.1 (172.16.10.1) 5.300 ms 5.312 ms 5.312 ms 4 203.82.82.249 (203.82.82.249) 22.306 ms 22.315 ms 22.305 ms 5 203.82.82.237 (203.82.82.237) 22.203 ms 22.196 ms 22.186 ms 6 72.14.196.121 (72.14.196.121) 23.907 ms 23.905 ms 23.905 ms 7 108.170.244.129 (108.170.244.129) 23.883 ms 108.170.244.145 (108.170.244.145) 24.125 ms 108.170.244.161 (108.170.244.161) 24.113 ms 8 8.8.8.8 (8.8.8.8) 23.872 ms 23.861 ms 23.851 ms |
“(8.8.8.8)” is the destination, “64 hops max” is the maximum number of hops, and “52 byte packets” indicates the size of the packets. In the traceroute above, “1.252 ms”, “0.685 ms”, and “0.676 ms” are the response times, in milliseconds, to the three packets sent to the first hop. The first three hops in this output indicate a local network, and eventually, the hops travel over different network providers. It takes 8 hops to reach the end destination.
You can adjust traceroute settings based on the device you’re using. In this example, setting the “-m” flag sets the maximum number of hops traceroute will use before ending.
prompt> traceroute -m 255 8.8.8.8
|
traceroute to 8.8.8.8 (8.8.8.8), 255 hops max, 60 byte packets 1 router.local (192.168.1.1) 0.745 ms 0.808 ms 0.916 ms 2 10.0.0.1 (10.0.0.1) 2.726 ms 2.799 ms 2.923 ms 3 68.85.73.213 (68.85.73.213) 14.330 ms 14.514 ms 14.622 ms 4 68.85.73.214 (68.85.73.214) 15.021 ms 15.210 ms 15.291 ms 5 ae-52-ar01.newbrunswick.nj.newjersey.comcast.net (68.85.138.53) 15.228 ms 15.293 ms 15.369 ms 6 be-22709-cr02.newyork.ny.ibone.comcast.net (68.86.92.89) 16.478 ms 11.819 ms 13.952 ms 7 be-12021-pe02.60hudson.ny.ibone.comcast.net (96.110.34.102) 11.560 ms 11.657 ms 11.772 ms 8 72.14.212.57 (72.14.212.57) 11.666 ms 12.802 ms 11.698 ms 9 209.85.254.175 (209.85.254.175) 11.693 ms 11.760 ms 11.856 ms 10 dns.google (8.8.8.8) 11.828 ms 11.942 ms 11.973 ms |
Traceroutes leverage time to live (TTL), which is normally used to prevent routing loops and general overconsumption of network resources. The TTL is typically set to a value, and each router decreases the TTL by 1. If the TTL reaches 0, it’s dropped.
Traceroute works by sending a TTL=1, which makes it to the first hop and the router signals that it dropped the packet. Then, traceroute increases the TTL=2 and so on until the packet reaches its destination. In some cases, networks block these types of packets.
Additionally, packets don’t always take the same route. Sometimes, the routes change based on a router's availability. For instance, if a router is unavailable, the packet would have to take another route to reach its destination. Fortunately, there are typically many routes to a destination.
However, not all routes are optimal for the best user experience. This makes troubleshooting even more difficult, as a user could have issues over a particular route.
Manual traceroutes lack full context
Imagine a user is having application response issues, but the network operations team doesn’t see any latency issues after analyzing the route from the user’s device to the destination.What happened? It appears that the user’s issues have been resolved, but the user calls the service desk again the next morning with a similar issue. Again, when the NetOps team manages to get access to the device and check the route, they don’t see any issues.
In this case, getting access to the machine or getting the end user to run a traceroute requires coordination and time is wasted. Depending on the issue, the operations team may catch it. For example, if it’s the Wi-Fi or internal network, it might be easier to identify. However, if it’s an ISP related issue they may or may not catch it, as those routes typically switch within milliseconds. With manual tools such as traceroute, they are good point-in-time solutions, but don’t provide insights across a user’s experience in real time, which only serves to increase troubleshooting times.
Traceroute also shows IP addresses and sometimes DNS names to help identify the routes. However, it doesn’t show the geographical information. With easily accessible geographical data, it’s easier to visualize the different hops. For example, if a user is located in Florida, US, and they’re accessing a SaaS application whose traffic routes to Europe then back to the US, network operations can quickly discern that there’s something wrong with the route.
Ensure flawless end user experiences with Zscaler Digital Experience (ZDX)
ZDX helps IT teams monitor digital experiences from an end user perspective to optimize performance and rapidly fix application, network, and device issues. In particular, one of the key ZDX capabilities for network operations teams is rapid visualization where network paths cause performance issues. NetOps teams are given the power to track metrics across Wi-Fi, local ISPs, and corporate and vendor networks to easily spot latency or packet losses between hops.
Let’s examine how ZDX helps you quickly triage network performance issues. Below is an example of a path from an end user to a destination. ZDX captures network path data at higher frequencies, lets you choose a point in time when a user indicated they were having performance issues, and offers visibility into the Cloud Path to pinpoint the root cause.
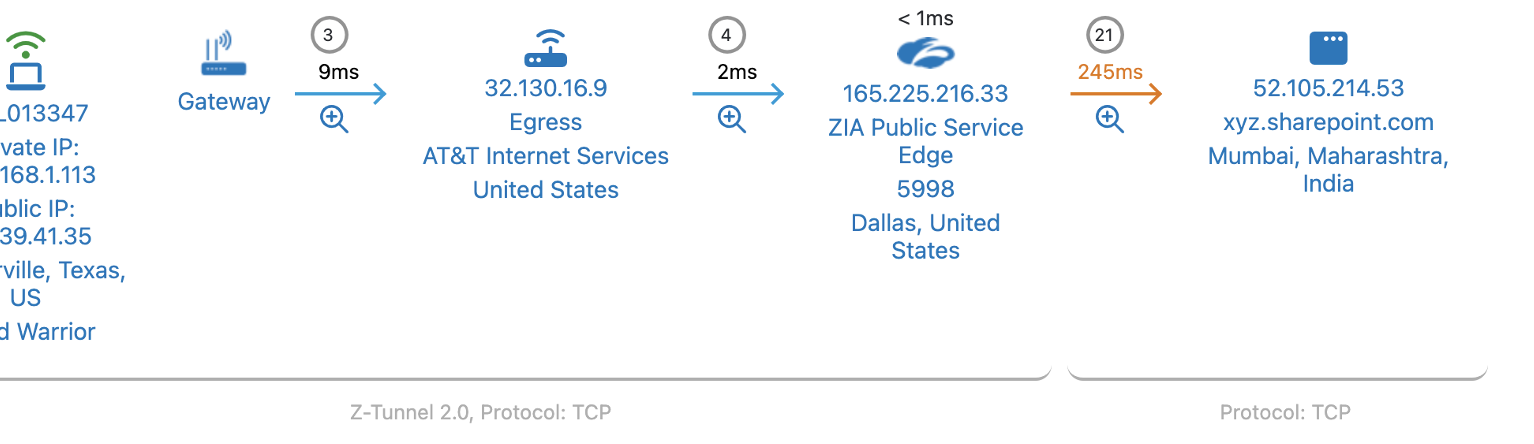
ZDX dashboard showing the overall Cloud Path
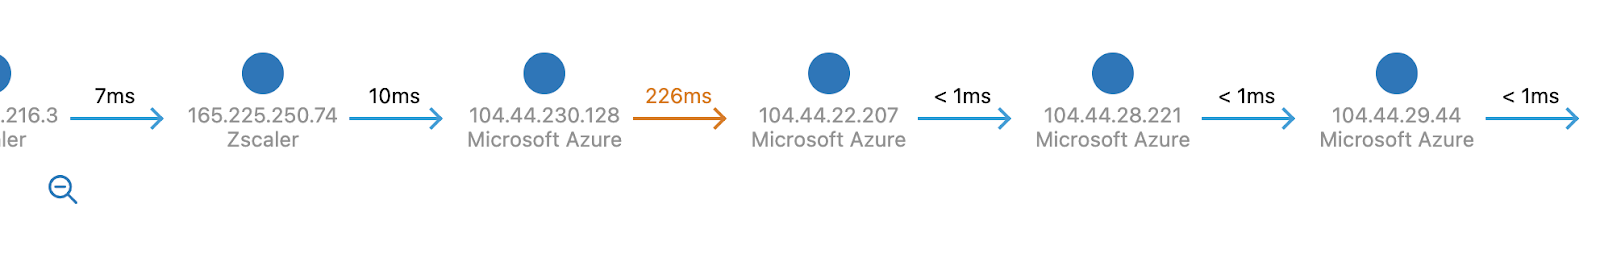
Drill into the hops to see the actual latency within ZDX
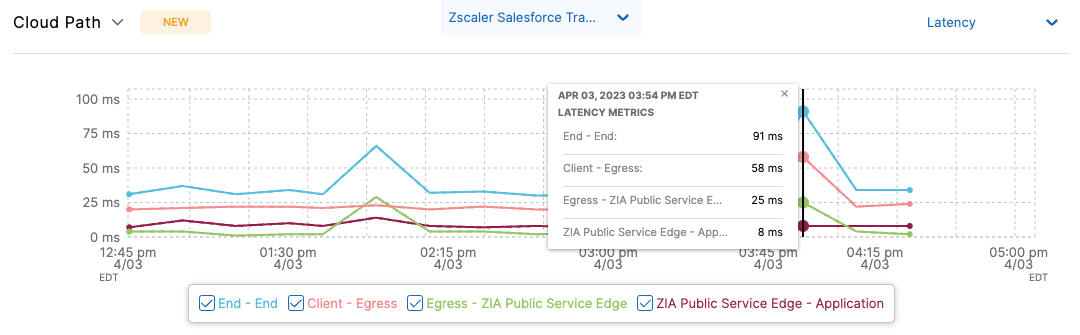
ZDX Cloud Path latency chart to identify issues
Cloud Path probes are used to collect the following metrics:
- Hop Count: The number of hops between each hop point on the path.
- Packet Loss: the % of packet loss at each hop point on the path.
- Latency (Average, Minimum, Maximum, and Standard Deviation, aka Jitter): This is the roundtrip path time measured in milliseconds.

ZDX Cloud Path command line view
Network hops block ICMP traffic, now what?
There are instances when network hops such as routers or firewalls block ICMP packets, limiting the response. ZDX uses Adaptive Mode to select the best protocol for the cloud path to reach its destination. Adaptive mode tries the TCP, UDP, and ICMP protocols for each run and picks the best available protocol for the probe.

Configuring Adaptive Mode within ZDX
Overall, traceroute is a valuable tool, but it presents clear challenges when it comes to troubleshooting an end user’s experience. Namely, it lacks historical information, reverse traceroutes are difficult, choosing the optimal protocol is time consuming, and it doesn’t scale for global organizations. Network operations teams can benefit from tools such as ZDX to quickly analyze an end user’s experience and provide root cause.
To learn more about ZDX, sign up for a demo!


